 DASAPT
 Xinren Chen
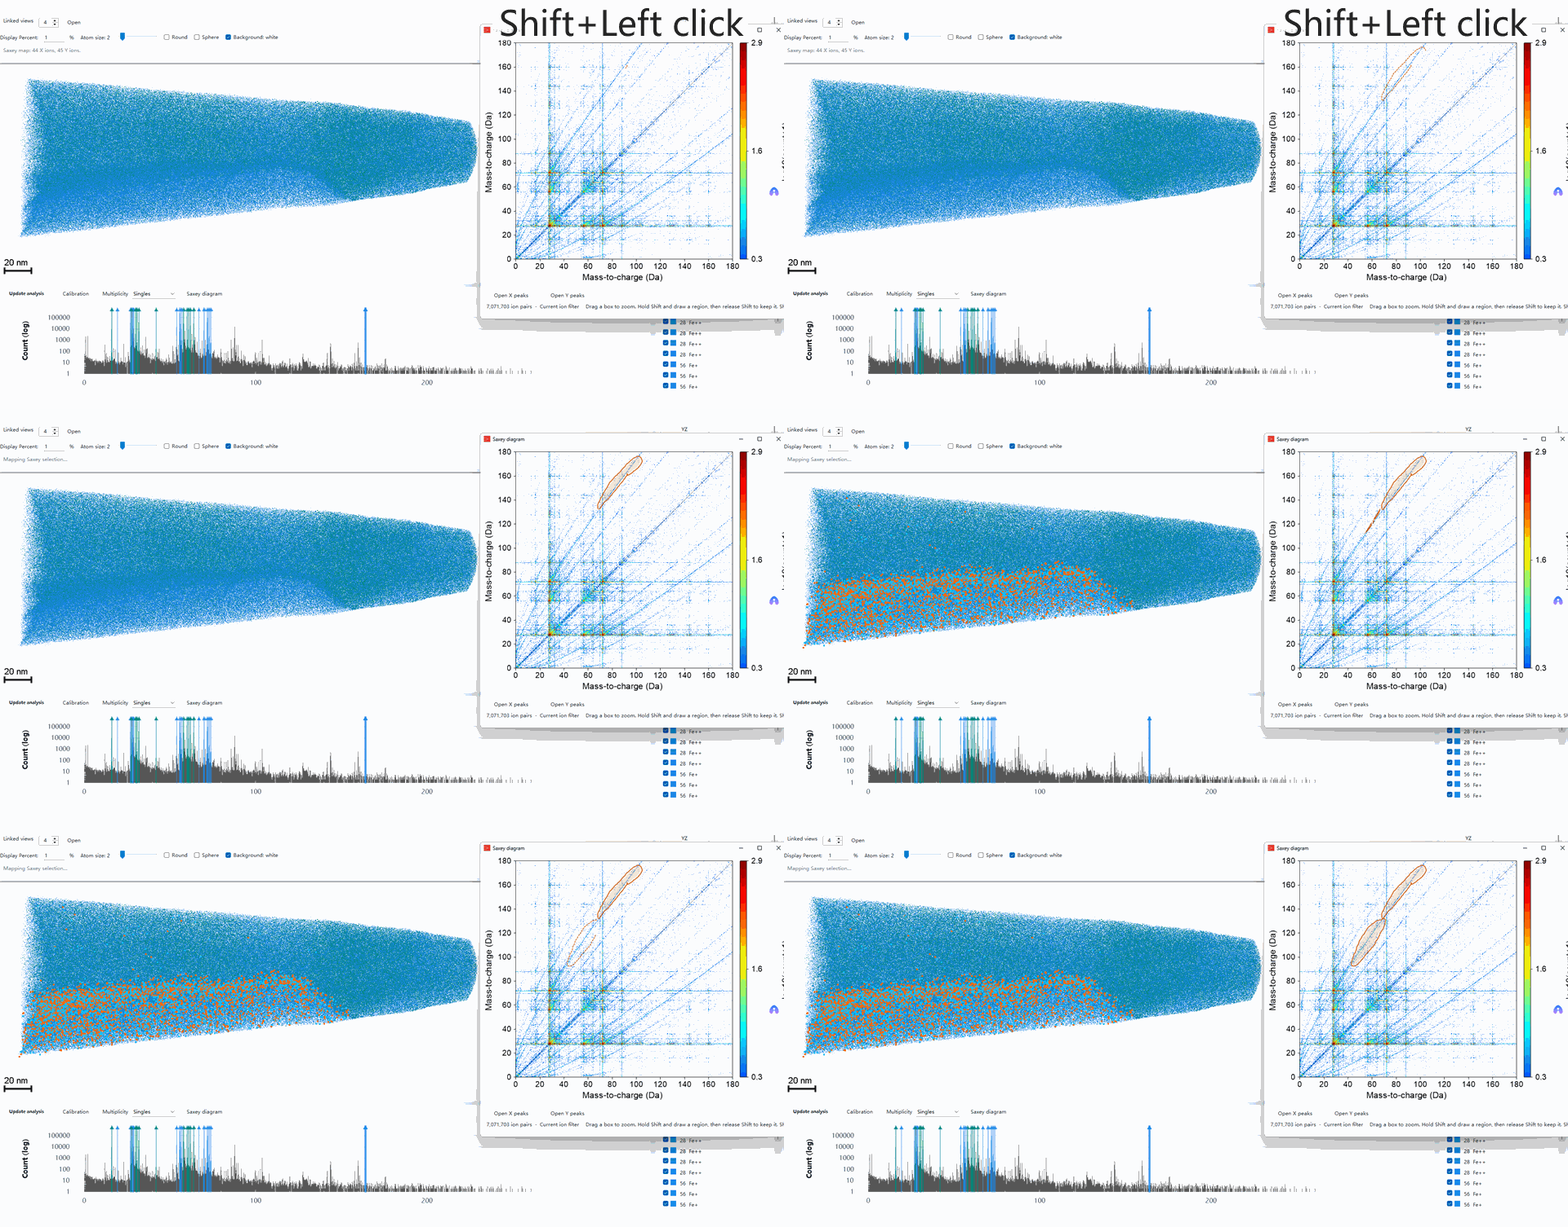
A Saxey diagram plots the mass-to-charge ratio of two ions detected on the same pulse. If the two ions leave the surface already separate, each one falls through the full acceleration voltage and lands at the intersection of its true mass-to-charge ratios. On the diagram that is a point.
A molecular ion is different. It leaves as one ion and splits into two fragments somewhere on the flight to the detector. The split can happen anywhere between the specimen surface and the detector, so the event does not sit on a single point.
The voltage still left when the ion splits sets the apparent mass the instrument reports:
- Split just after leaving the surface. Each fragment is accelerated on its own and appears at its true mass-to-charge ratio. That end of the tail sits on the peak intersection.
- Split close to the detector. Both fragments have traveled almost the whole way at the speed of the parent ion. The instrument still assigns mass as if that charge had been accelerated over the full voltage, so both fragments are placed at the parent’s mass-to-charge ratio. That end of the tail falls on the diagonal.
- Split in between. One fragment’s apparent mass rises and the other’s falls, so the point lies between those two ends.
The break position varies continuously, and the points join into a line. Kinetic energy released in the dissociation gives the line some width, which is why it looks like a tail. One mass moves up while the other moves down, so the slope is negative.
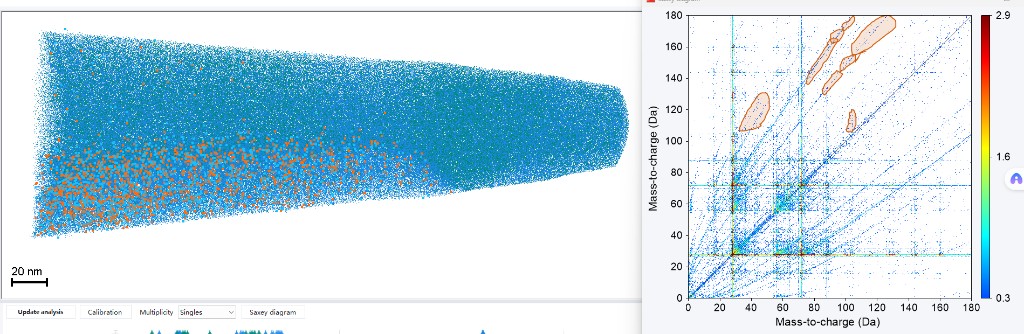
In the figure, the outlines on the right follow those negative-slope tails. The orange ions on the left are the ion pairs inside the outlines, drawn back onto the reconstruction. The cyan ions are the rest of the specimen. The selected pairs are not spread evenly through the needle. They lie toward the lower side. The scale bar is 20 nm.
A second kind of tail runs up and to the right. Both ions evaporated a little late, both flight times became longer, and both apparent masses increased together. That tail is an energy deficit, not this dissociation tail. The regions in the figure follow the streaks above the diagonal.
References
- Saxey, D. W. Correlated ion analysis and the interpretation of atom probe mass spectra. Ultramicroscopy 111, 473–479 (2011). https://doi.org/10.1016/j.ultramic.2010.11.021
- Gault, B., Saxey, D. W., Ashton, M. W., Sinnott, S. B., Chiaramonti, A. N., Moody, M. P. & Schreiber, D. K. Behavior of molecules and molecular ions near a field emitter. New Journal of Physics 18, 033031 (2016). https://doi.org/10.1088/1367-2630/18/3/033031
0 comments
Sign in to comment.